Discover the
Real Performance of Trading Signals
Comprehensive statistics to find the best trading signals.
- Volume analysis to identify market reactions
- Price movements to spot winning patterns
- Market comparisons for better trading decisions
- Advanced trading insights to refine your strategy

Featured Trading Signals
Discover key market signals that can help identify potential trading opportunities. More signals coming soon!

MACD Histogram Crossing
from Negative to Positive
When the MACD histogram turns from negative to positive, it may indicate a bullish momentum shift and potential buying opportunity.
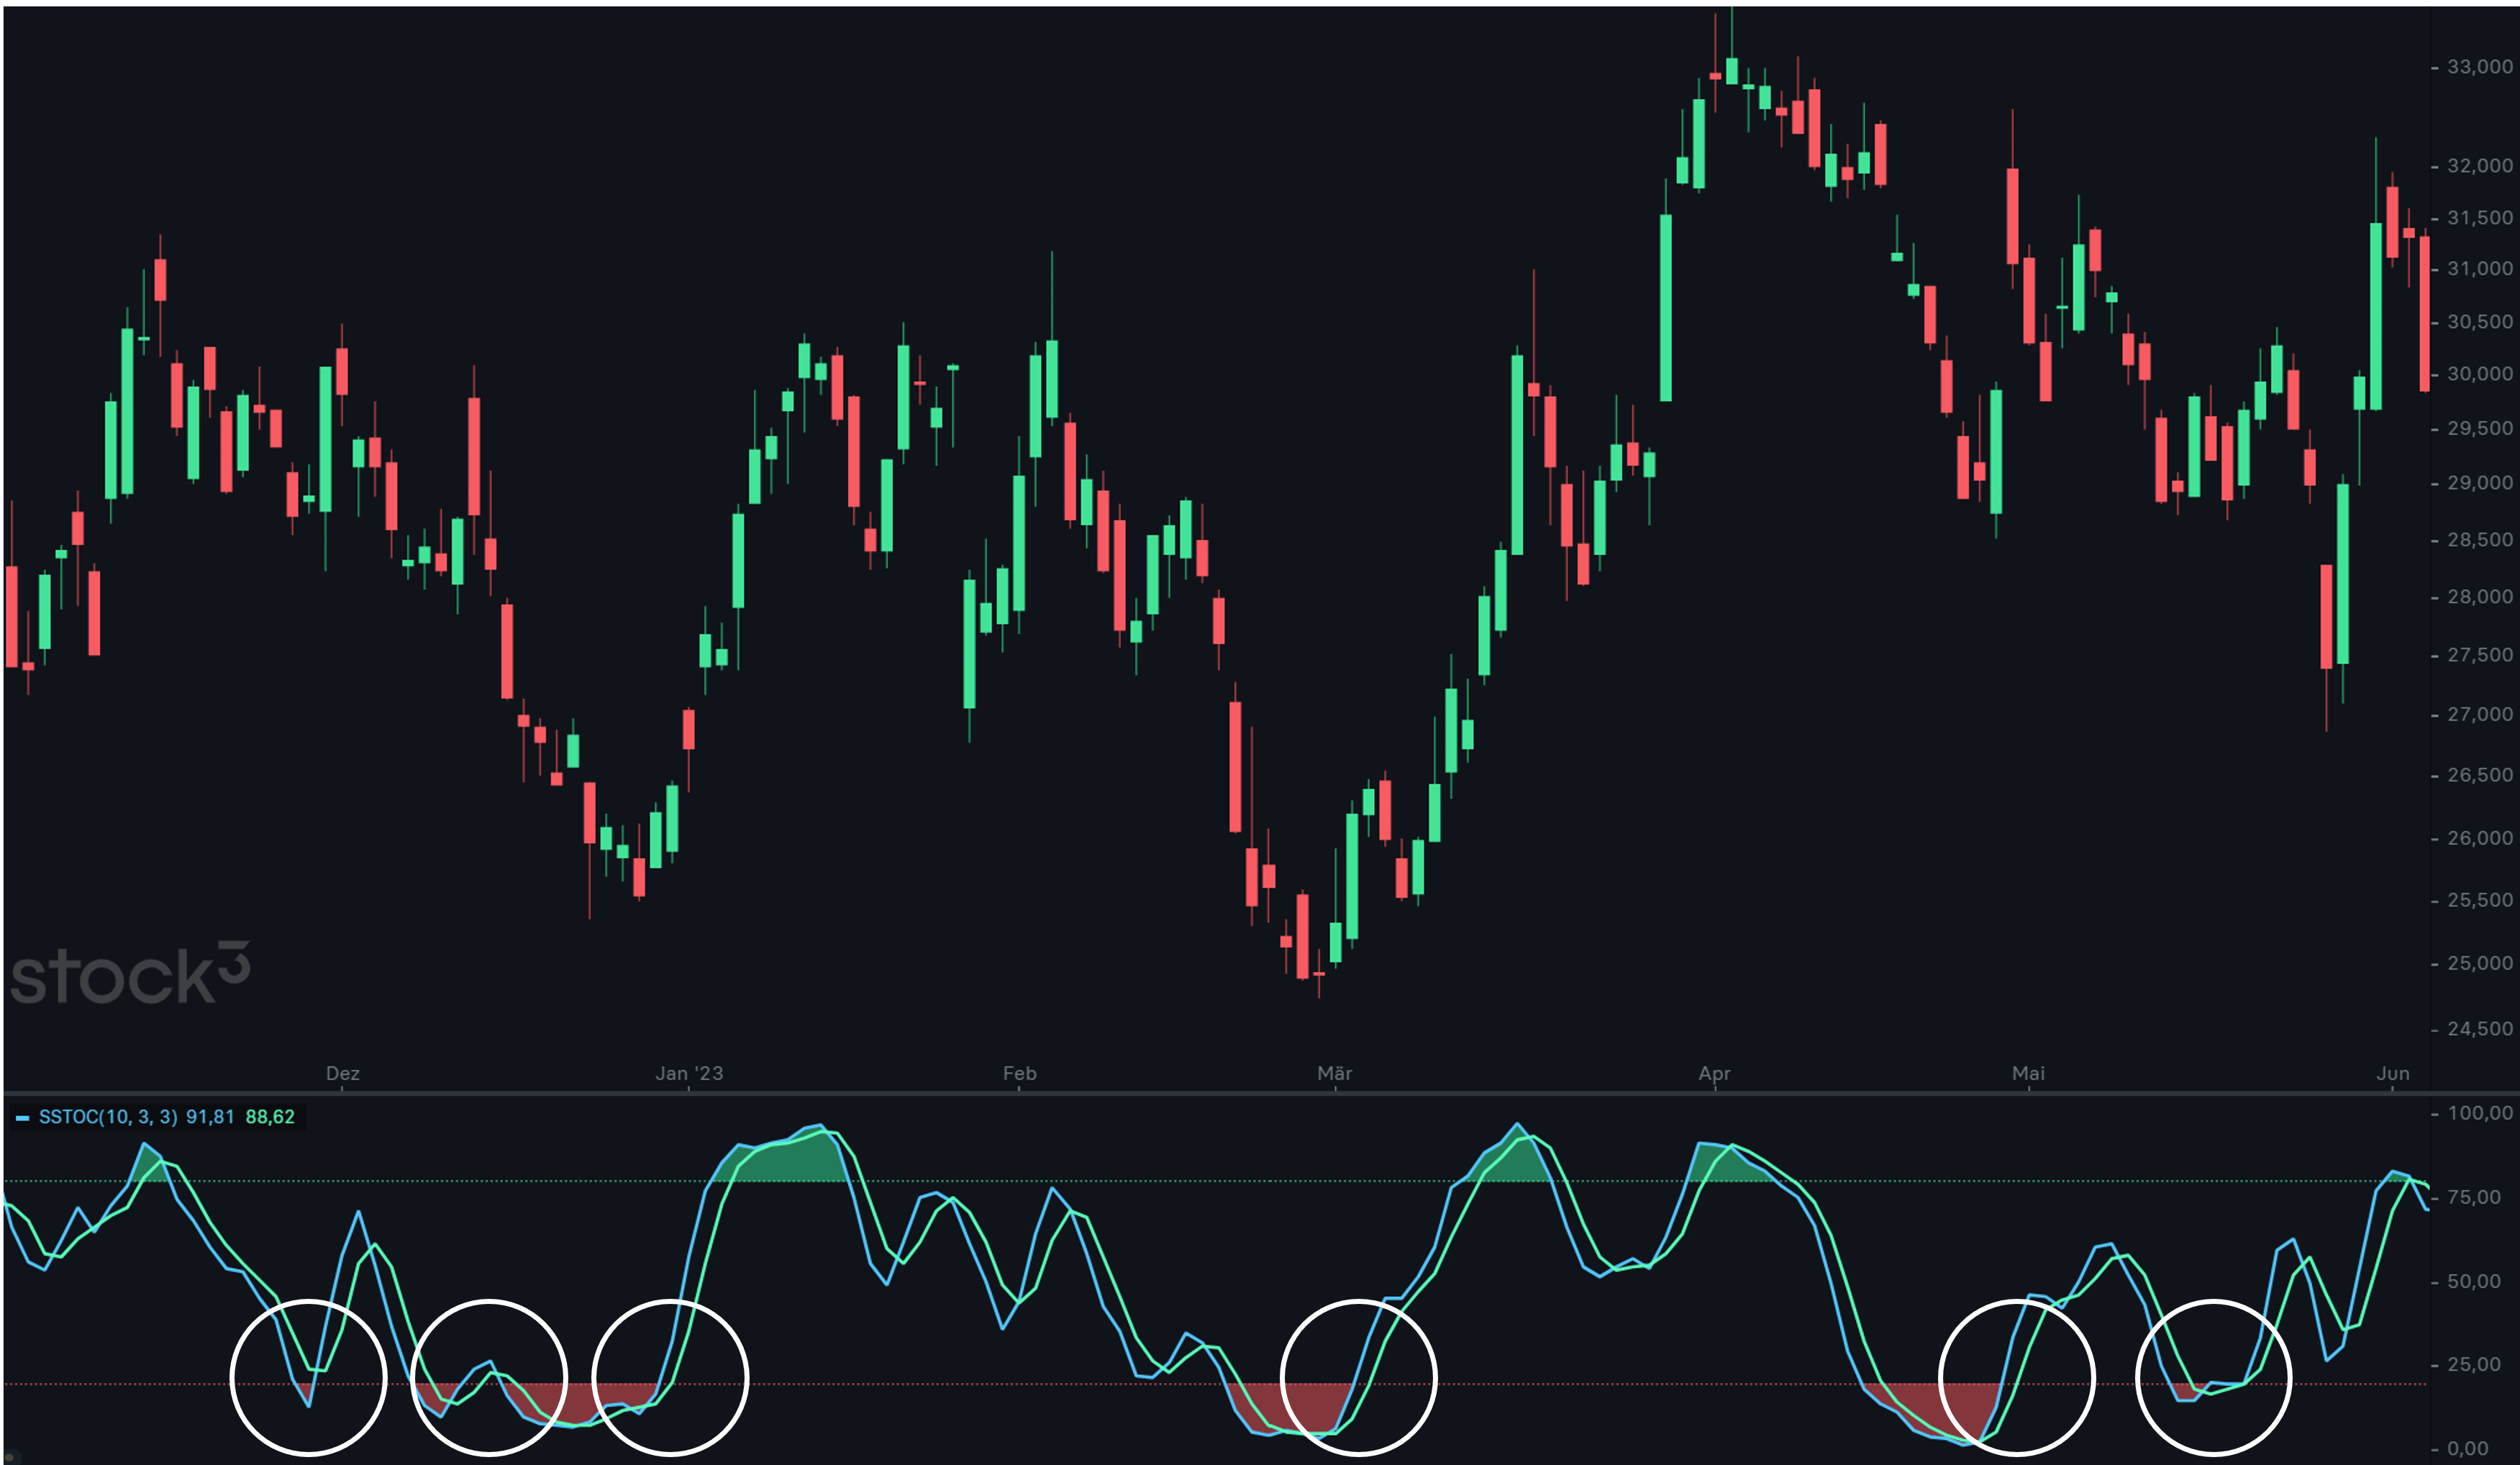
Stochastic Crossing
20 Line Upwards
When the slow stochastic indicator moves above the 20 level, it can signal a possible trend reversal from oversold conditions.

MACD Histogram Double Rise in Negative Zone After Downward Movement
After a downtrend, the MACD Histogram shows two consecutive rises in negative territory, signaling a potential bullish reversal.

Bollinger Rebound from Lower Band
When the price rebounds from the lower Bollinger Band, it can signal a potential trend reversal from oversold conditions.

RSI Crossing from Oversold to Normal
When the slow stochastic indicator moves above the 20 level, it can signal a possible trend reversal from oversold conditions.
More Signals Coming Soon!
Stay tuned as we introduce more trading signals to enhance your market analysis.
Available Instruments for Analysis
- US Stocks (NASDAQ 100 and Dow Jones)
- German DAX 40 Stocks
- Daily, Weekly & Monthly OHLC Data
- Up to 10 Year Historical Analyis

„The secret to being successful from a trading perspective is to have an indefatigable and an unquenchable thirst for information and knowledge.“
Paul Tudor Jones
Hedge Fund Manager